05th April 2024
Researching changes in the local economy over time
One of our Trustees, John Stevens, highlights a welcome new resource for exploring historical themes, which offers some surprising discoveries.
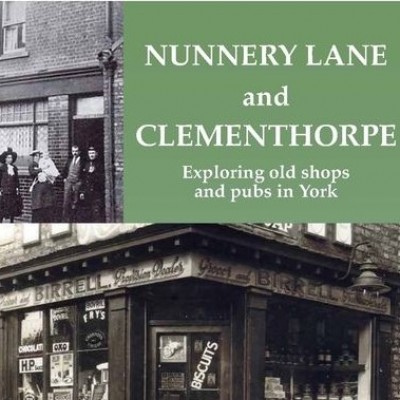
When we researched the development of Clementhorpe in our book Made in Clementhorpe: Exploring York’s Industrial History, we tried to set the story in the context of wider economic changes in York. We made use of the census of population, trades directories and other published secondary sources.
Now, there is a new online source which can help us to review employment trends over a long period of time. The Economies Past resource, developed by the University of Cambridge, can be found at https://www.economiespast.org/. It features in today's Guardian.
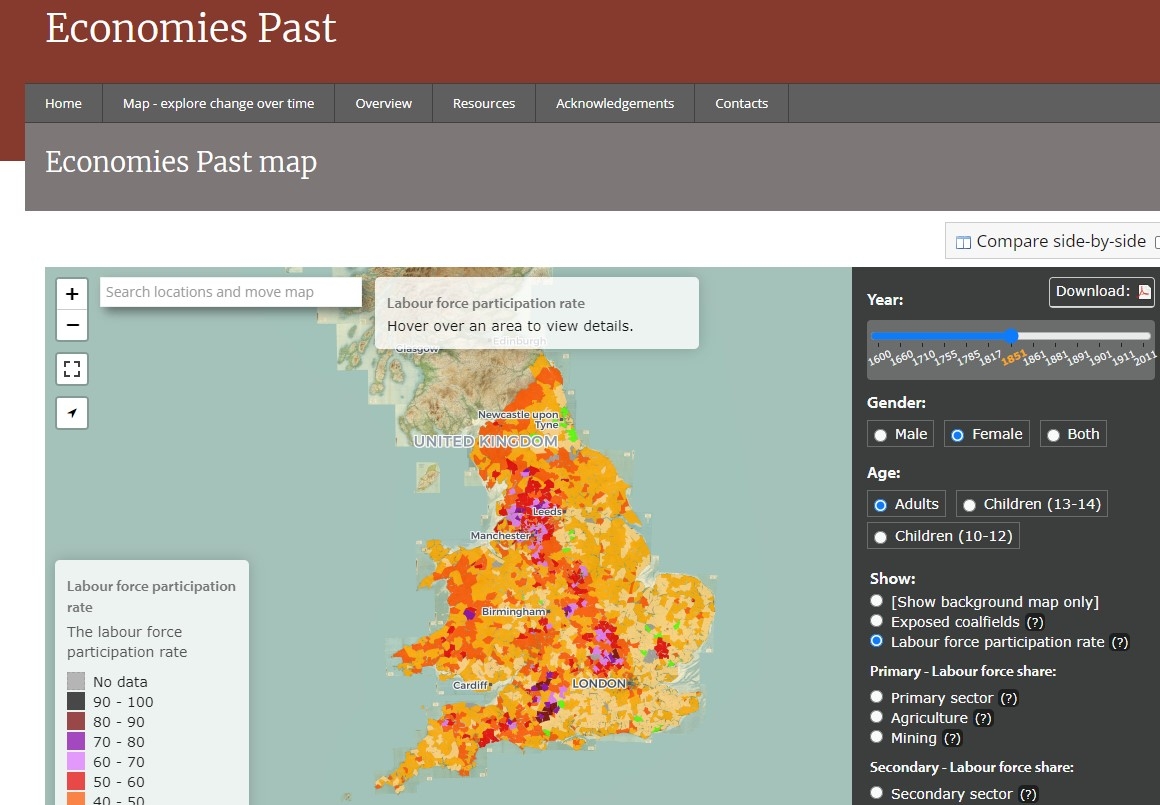
From https://www.economiespast.org/
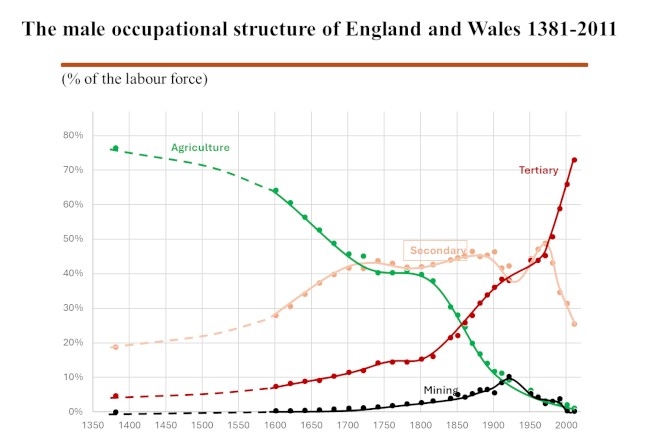
A team of historians have collected a huge volume of data, providing a detailed quantitative picture of changes in occupational structure across England & Wales. A set of interactive maps allow the user to dig down and look at trends in their own area of interest. There is also a handy single-page guide on how to get the most out of the resource.